What is Gantt Chart – Importance of Gantt Chart in Project Management
Henry L. Gantt, an American engineer, and social scientist developed Gantt a chart as a production control tool. Gantt chart is used as a project management tool, and it provides graphical illustration of project schedule. As a project management tool, Gantt is helpful to plan, coordinate, and track specific tasks in a project. Gantt charts can be drawn on a graph paper. This can be automated using software applications as well.
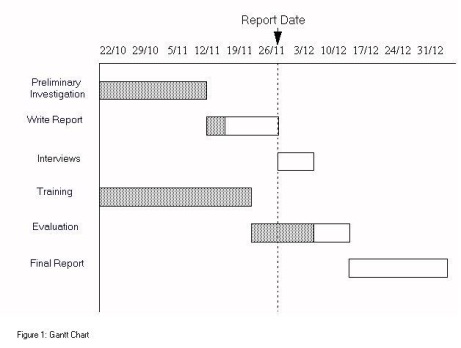
Graphically Gantt chart is represented with two axis i.e. horizontal axis and vertical axis. Horizontal axis represents total time span of the project, broken down into increments and vertical axis represents the tasks that make up the project (task involved like conduct research, choose software and install software). Horizontal bars of varying lengths represent the sequences, timing, and time span for each task.
From the above graph, let us consider the ‘Primary Investigation’ and ‘Write report’ tasks respectively. We would draw the bar line for both the task that represents the amount of time you expect to spend on research. As the task processes ‘Write report’ task arrowheads or darkened bars may be added to indicate completed tasks, or the portions of tasks that have been completed. A vertical line is used to represent the report date.
Gantt chart software helps to visually represent the breakdown of tasks in a project over time and proves to be integral to project management. It simultaneously shows a timeline for tasks while also taking into account contingencies between tasks. Gantt charts differ from traditional timeline which are meant to break down workflows, focusing more on the interdependencies between tasks rather than the broad picture.
There are many popular Gantt chart software’s used. SmartAdminManager.com has a tool which helps to review project progress. It is easy to use and it enables project monitoring. It helps in reviewing progress in tasks, and meeting milestones, and is available for the whole project or for any specific task.
This, Gantt charts help us to give a clear illustration of project status. Automated Gantt charts store more information about tasks, such as the individuals assigned to specific tasks, and notes about the procedures. Gantt charts can be easily changed and can be adjusted frequently to reflect the actual status of project tasks. However, in Gantt charts you cannot tell how one task falling behind schedule affects other tasks. The PERT chart is another popular project management charting method, is designed to do this.
SMART ADMIN is a cloud-based software for generating GST Compliant Invoice, Payroll management, Timesheet and Project Tracking – visit SMART ADMIN for FREE Trial and Registration.
Related Post


How AI is Redefining Office Productivity...
For decades, office productivity software was a suite of digital hammers and saws—tools that sat idle until a human picked them up to stri...
Timesheet and Implementation – Change Management...
The digitization of workforce management has emerged as a strategic necessity for Indian organizations, on account of the need for regulator...
Boost Your Business Efficiency with Automation...
In the contemporary digital environment, the success of a business links with its ability to operate efficiently, maintain organization, and...